Dashboard
Your command center for active leads, pipeline value, won revenue, stage breakdowns, top scores, and recent activity.
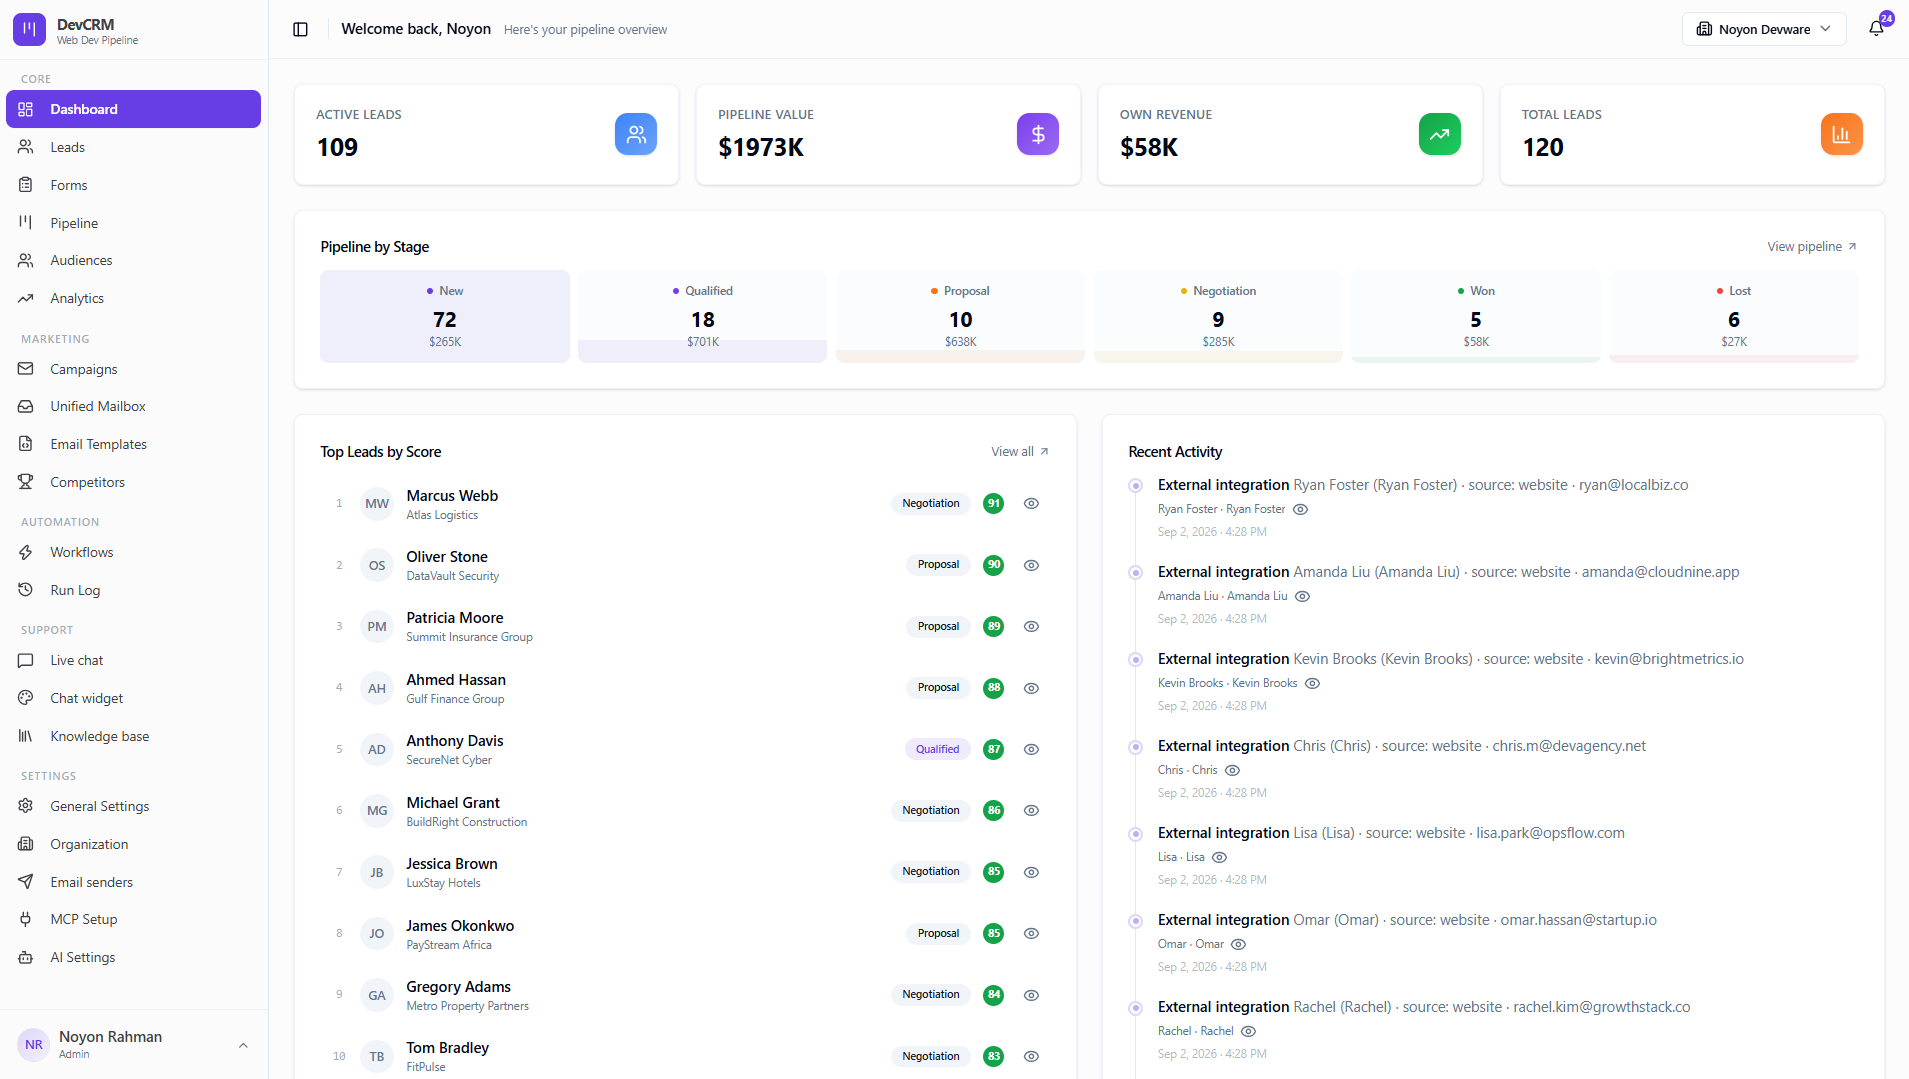
What you see
KPI cards
Active Leads, Pipeline Value, Own Revenue, and Total Leads. Click any card to jump into Leads, Pipeline, or Analytics.
Pipeline by Stage
Each stage shows deal count and dollar value (New, Qualified, Proposal, Negotiation, Won, Lost — or your custom stages).
Top Leads by Score
Highest-intent contacts with score and stage — open View lead details to work the deal.
Recent Activity
Latest emails, notes, and stage movements across the team so nothing falls through.
Tips
- Start every day on the Dashboard, then drill into Pipeline for deals that need a next step.
- If Own Revenue looks low, check that won deals have deal values set on the lead.
Ready to get started?
Create your workspace, invite your team, and start closing deals in minutes.
Open DevCRM